infrastructure
How an AI Agent Swarm Ships 55 PRs/Day on Self-Hosted CI
A swarm of ~30 AI coding agents merges 55 PRs/day on a custom Fly runner fleet. The pipeline that makes it honest: a fail-closed CI gate, drain-aware Fly runners, a two-tier cache, and an auto-fixer that fixes its own.
Most teams I talk to have one or two AI coding agents on a leash. They write code, a human reviews it, the human merges. Maybe twenty pull requests a week if the cadence is good.
We run a different shape. One solo operator. Roughly thirty AI coding agents working concurrently. 55 merged pull requests a day on average over the last 30 days. 66 a day over the last 7. Peak day so far: 111. Median time from queue to merged commit: 5 minutes.
That throughput does not come from the agents. It comes from the pipeline they push code through. This is a walkthrough of the actual infrastructure — what it looks like, why each layer exists, and what nobody talks about when they post screenshots of "100 PRs a day."
What the swarm actually produces
Every number below is measured, not aspirational. Sources are real production logs from the runner fleet at infra-gha-runners-fly, snapshot taken 2026-06-09.
- Throughput. 1,648 merged PRs across the org between 2026-05-10 and 2026-06-09. Mean 55/day. Last 7 days: 66/day. Peak day: 111 (2026-05-21). Fleet sized for ~300/day org-wide before we have to add hardware.
- Latency. Mergify merge-queue baseline across a 24-hour window: 32 merges, median 298s (5.0 min), p90 361s (6.0 min), max 529s (8.8 min). The distribution is tight — no long-tail stalls.
- Reuse. 63 reusable composite GitHub Actions shared across every repo in the fleet. When one improves, all of them get it on the next push.
- Operator. One human. Roughly 30 parallel agents across Claude Code, Cursor, Codex, Copilot.
Those are the headline numbers. The architecture is what makes them honest.
The architecture in one picture

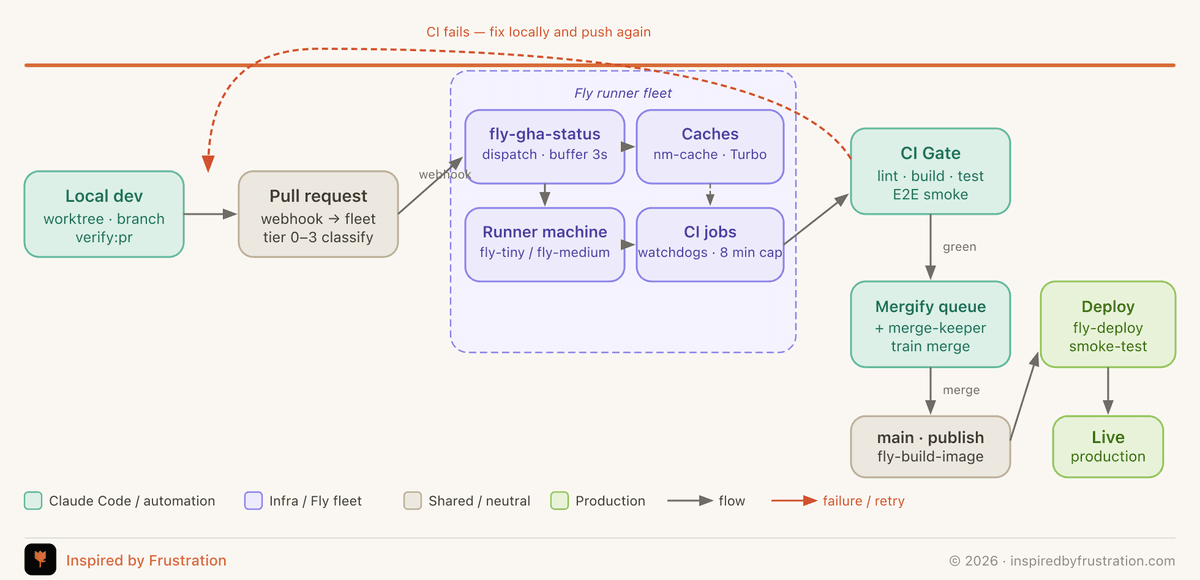
The flow is linear when it works:
- Agents and the operator commit and push from local worktrees.
- GitHub opens a PR in the TeamK2K org.
- The PR webhook lands on
fly-gha-status, which dispatches a JIT runner machine on a Fly app calledfly-gha-medium. Caches and watchdogs attach to it. - The CI jobs run on that machine — lint, test, build, schema validate, the works.
- A single required check — the CI Gate — aggregates every job's result and either passes or fails the PR.
- If green,
k2k-merge-keeperauto-queues the PR into Mergify after a 5-minute settling window. - Mergify rebases, re-runs CI on the merge train, merges to
mainas a merge commit (no squash). - Post-merge, the infra repo deploys runner-fleet changes; consumer repos deploy their own images. Both end at Fly.io with telemetry feeding back to the status dashboard.
The red return arrows on the diagram are the failure paths. A failed CI Gate kicks back to local dev. A stuck merge queue loop kicks back into k2k-merge-keeper for sweep and re-queue. Both are part of the pipeline, not exceptions to it.
That is the surface. The interesting part is what each box has to do to survive ~30 agents pushing at once.
The five hard parts
1. The CI Gate is a fail-closed aggregate
Branch protection on GitHub requires named status checks. Fast-lane CI lets low-tier PRs (docs-only, lint-only) skip the expensive jobs — but a skipped required context never reports success, so the PR sits forever in BLOCKED.
The CI Gate is the fix. It's a single required check that reads ${{ toJSON(needs) }} and decides:
success→ passskipped(legitimate tier skip) → passfailure/cancelled→ block- missing / unknown result → block (fail-closed)
- empty / unparseable input → block (fail-closed)
The gate runs on GitHub's hosted ubuntu-latest — not on the Fly fleet. That's deliberate: if the Fly fleet is saturated or down, the gate still reports a verdict, so consumer PRs are never silently held by infra outage. The classifier that decides the tier upstream is the deliberate inverse — it fails open so unknown paths always run the full pipeline rather than silently skipping work that should have run.
One required check, fail-closed where it matters, fail-open where it doesn't. That single design choice is what made fast-lane CI safe to ship.
2. The merge queue is the throttle, not the bottleneck
With 30 agents pushing PRs in parallel, the temptation is to throw queue throughput at the problem. Wrong direction. The merge queue is the throttle that protects main from a green-on-PR / red-on-merge race condition; you don't want it faster, you want it predictable.
Mergify rebases each PR onto the latest main, re-runs CI on the merged result, and only then writes the merge commit. That's why our median is 5 minutes — that's the cost of one extra CI run per merge, not network or GitHub latency.
Two pieces of automation keep the queue honest:
k2k-merge-keeperwaits 5 minutes after a PR goes green before auto-queueing it. That window catches the agent that wants to push a one-line fix on top of its own green PR — no orphaned merges, no requeue churn.- A queue-keeper cron runs every 10 minutes, calling
mergify-queue-keeper.shagainst a fleet source-of-truth JSON. It catches stuck-queued PRs, sweeps orphans, and triggerssweep-stuck-queued.ymlwhen a draft train looks wedged. The same baseline window captured 2 live batch bisections in 24 hours — those are merges where Mergify automatically split a batch to isolate a failing PR.
The queue is the only thing on the diagram with a built-in retry loop drawn back to itself. It earns it.
3. The cache layer is two-tier and content-addressable
The single most expensive thing the fleet does per job is install dependencies. Bun lockfiles, Next.js cache, Turbo outputs — across ~30 active repos, that's hundreds of gigabytes of duplicated work if you don't deduplicate it.
We run two independent caches on Fly apps:
fly-gha-nm-cache—node_modulesarchive cache. Workspacenode_modulesget tar+zstd compressed and uploaded after every successful job. Storage iss3+volume: a Tigris S3 bucket as the durable copy, a local NVMe volume on the cache machine as a read-through LRU. Compression iszstd -9 --long=26.NM_MAX_CONCURRENT_PUTS=1to keep concurrent uploads from OOMing the cache machine. Cache key is<repo>/<pathid>-<lockhash>.tar.zst. Archives top out around ~377 MB per repo (measured 2026-05-11).fly-gha-turbo-cache— Turborepo remote cache, also Tigris-backed. HMAC-signed artifacts viaTURBO_REMOTE_CACHE_SIGNATURE_KEY. Per-repoTURBO_TEAMpartitioning so a hit on one repo's tests can't accidentally feed another's build.
A cache hit means bun install --offline, and the job moves on. A miss falls back to --prefer-offline then a real install — still cheaper than cold-start because Bun is already on the runner image.
The economic effect: most jobs land in the seconds-to-tens-of-seconds range for install, even though we're not running self-hosted SaaS like Vercel or Nx Cloud. The Tigris layer means a lost or replaced cache machine re-warms from the bucket instead of cold-starting the entire fleet.
4. The runner fleet is JIT, drain-aware, and machine-class-tuned
The default CI/deploy pool is fly-gha-medium — performance-4x machines with 8GB RAM and a 20GB cache volume. Max 6 machines. Warm floor of zero. Idle trim down after 3 minutes, sleep to zero after 10.
When a PR webhook lands, the status app spins up a JIT runner. The runner registers itself with GitHub, picks up the job, runs it, and goes away. No long-lived stateful runners. No drift between machines.
The piece that surprised us was the drain-aware deploy. When we ship a runner-fleet change, the deploy workflow:
- Stamps a
release_drain_untiltimestamp via the status app config API. - Announces drain to every started runner.
- Parks idle loop-mode machines that aren't currently mapped to active jobs.
- Blocks rollout until GitHub reports zero busy runners for the pool.
- Rolls the image.
- Clears the timestamp.
Drain budget: 480s (8 minutes). That matches the on-runner work cap (FLEET_JOB_MAX_SECONDS=480) — no job can outlive the watchdog, so the drain never needs to wait longer than the budget. While the timestamp is in the future, dispatchRunner returns release-drain-active and the webhook leaves new work queued instead of assigning it to a pool that's about to roll.
Net effect: we ship runner-fleet changes during peak CI traffic without killing in-flight consumer jobs. The runner you started ten minutes ago finishes on its image. The next one starts on the new one.
5. The auto-fixer is an agent fixing the agents' agents
When CI breaks, the worst outcome is not the broken PR — it's the 12 PRs queued behind it that now think the gate is wedged. So the fleet runs an autonomous workflow called ci-auto-fixer that does triage and patching.
Eight named detectors so far:
- Timestamp collision — two PRs racing the same migration filename
- Wrong runner pool label — a PR pinned to a label that doesn't exist anymore
- Missing composite — a workflow calling an action that hasn't been deployed yet
- Missing type checks — typecheck job removed without a replacement
- Missing build cache —
next-build-cachestep removed from a workflow - (Three more in the same shape — root-cause patterns observed in the wild.)
Each detector ships with a triage mode (does this match?) and a patch mode (generate a PR with the fix). The patcher is allowlist-gated by repo, validates its own patch by running CI on the PR before opening it, and shares a fleet-wide daily budget cap so a bad detector can't auto-PR-spam an entire org.
The auto-fixer is itself an AI agent inside the swarm. The interesting bit is that it's restricted to a known class of failures — the ones we've already debugged once and know the shape of. New failures still page a human (me). The detectors grow when a new pattern shows up twice.
The economic surprise
The largest single discovery in the last six months was this: performance-4x on Fly is roughly eight times faster than shared-cpu-4x for the same workload, at roughly tied dollars per run.
We measured it directly — the portal Vitest suite ran in ~44 seconds on perf-4x versus ~360 seconds on shared-cpu-4x. The shared-CPU tier throttles to ~0.1 effective core under sustained CI load, which the original 2026-04-16 utilization telemetry under-counted because it was measuring already-throttled usage.
Two months before we ran that bench, every utilization graph said the shared tier was fine. The graph wasn't lying — it was measuring the wrong thing. The right benchmark is wall-clock job time at saturation, not aggregate utilization at steady state.
We migrated fly-gha-medium from shared-cpu-4x to performance-4x on 2026-06-14. The fleet got 8x faster overnight at the same monthly Fly bill. There is a lesson in there about benchmarking before you optimize that I'm still chewing on.
What it costs to run
Honest cost picture, because this is the part nobody publishes:
- Fly Machines. The medium pool is sized for 6 concurrent runners on
performance-4x. Cost scales with active job time, not provisioned capacity, because the pool sleeps to zero. Real monthly bill across the runner fleet plus the two cache apps plus the status dashboard is in the low-three-figure range — well under the cost of a single GitHub-hosted heavy-tier subscription at our throughput. - Storage. Tigris S3 for two caches plus snapshots. Single-digit dollars.
- Human time. This is the line item that matters. The fleet exists because one operator + 30 agents needed it to exist. Without it, throughput collapses to maybe 5-10 PRs/day because the human becomes the bottleneck.
The thing that took the longest to build was not any individual component — it was the combination. Each layer (gate, queue, cache, runners, auto-fixer) is straightforward in isolation. The hard part was making them not interfere with each other under 30-agent load.
What this enables back at the agents
The pipeline only matters because the agents at the top of the diagram can keep filling it. The orchestration loop that does that lives in two adjacent systems:
- AppHandoff is the coordination layer. MCP RPC at
POST /api/mcp-bot, Supabase Realtime kanban, stage flowbacklog → up_next → in_progress → validation → live. A DB trigger auto-closes a ticket when all required roles are marked complete. An LRU context cache (50 projects, 60s TTL) keeps tool calls under one round-trip to the database. Foreign tool calls are rate-limited at 30/min/project with a circuit breaker (5 failures opens it, half-open after 60s) and a per-invocation audit log. - endgame-skills is the cross-IDE skill pack. One
./install.shsymlinks the same skills into~/.claude/skills/,~/.cursor/skills/,~/.agents/skills/,~/.codex/skills/,~/.copilot/skills/. Three tiers (top-level, sub-skill, sub-sub-skill). Per-target manifests with stale-link pruning. Every agent in the swarm picks up the same vocabulary on the same day.
Those two systems plus the CI fleet are what "agent orchestration at scale" actually means in practice. Not a clever prompt. Not a single magic framework. A coordination layer, a shared skill pack, and a CI pipeline that doesn't melt when 30 agents push at the same time.
What we're still building
A few things are honest gaps. The fleet snapshot in this post is current to 2026-06-09 — real-time PR counts could be queried with the GitHub API but aren't on a live dashboard yet. The fast-lane router has 4 tiers (docs-only, lint-lane, typecheck-lane, full-pipeline); a fifth tier for migrations-only PRs would help the Supabase repos. MCP Beast's governance pipeline (policy, RBAC, classification, risk gate) is fully coded but currently dormant — every invoke writes to router_audit_log but the gates aren't enforcing yet.
If you want the running version of any of these claims, the source code is open inside the org and the proof library at docs/wave1.5/proof/proof-library.md cites every source file by repo:path.
FAQ
How does this compare to a managed GitHub Actions plan? Managed plans charge per minute and cap concurrency at fixed tiers. A self-hosted Fly fleet trades that for an operator-owned set of machines that sleep to zero when idle. Throughput cap is your hardware budget, not a vendor tier. We picked self-hosted because 30-agent parallelism would have been prohibitively expensive on hosted minutes, and because cache control mattered more than not running our own infra.
Why Fly.io specifically and not Hetzner or a fixed VPS? Three reasons. JIT runner machines that boot in seconds, so we can scale to zero without paying for warm capacity. Drain-aware deploys via the Machines API, so we ship infra changes during peak traffic. And Tigris S3 — a fully-managed S3 store that lives inside the Fly network, so cache fetches don't pay public-internet egress.
What's the failure mode when CI breaks?
The CI Gate fails closed. The merge queue stops queueing. k2k-merge-keeper and the queue-keeper cron both notice the stall and report it. The ci-auto-fixer agent triages — if the failure matches a known pattern, it opens a patch PR. If not, I get paged. The blast radius is bounded to the affected repo, not the fleet.
How many people would this need at a typical team? The fleet was built by one operator with agent assistance over about six months of evening work. Maintaining it is roughly half a day a week now that the auto-fixer covers the common patterns. Adoption inside a typical engineering team would be smaller in scope (you'd skip the multi-repo composites and the cross-IDE skill pack) but the core five layers are the minimum.
Is the source code open?
The infrastructure repo (infra-gha-runners-fly) is the source of truth for the runner fleet and lives in the TeamK2K org. The composites are reused by every consumer repo in that org. The proof library cited throughout this post is at docs/wave1.5/proof/proof-library.md in the inspiredbyfrustration repo and lists every source file behind every number.
If you're trying to do the same shape — one operator, many agents, real throughput — the order I'd build in is the reverse of how I described it: cache layer first (it pays for itself in two weeks), then the runner pool with drain-aware deploy, then the merge queue, then the CI Gate, then the auto-fixer. The auto-fixer only earns its keep once you have the patterns to detect.
The agents at the top are not the hard part. The pipeline they push code through is.
related paths